Online or onsite, instructor-led live Tableau training courses demonstrate through interactive discussion and hands-on practice how to use Tableau to create dashboards, worksheets and other visualizations to gain clearer insights into data.
Tableau training is available as "online live training" or "onsite live training". Online live training (aka "remote live training") is carried out by way of an interactive, remote desktop. Nijmegen onsite live Tableau trainings can be carried out locally on customer premises or in NobleProg corporate training centers.
NobleProg -- Your Local Training Provider
Nijmegen
Fifty Two Degrees, Jonkerbosplein 52, Nijmegen, Netherlands, 6534 AB
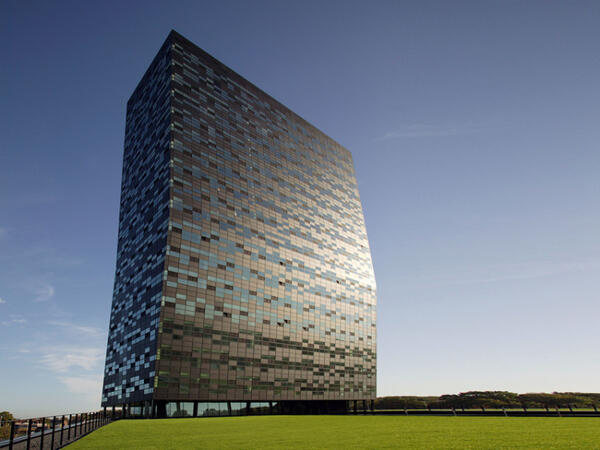
Located in FiftyTwoDegrees, a striking black tower of 18 floors with a 'kink' in the top that is at an angle and known as an unrivaled business address in the east of the Netherlands. FiftyTwoDegrees is designed as a unique business, cultural and social center and is a combination of high concentration of knowledge companies and well thought-out offices that are grouped around a central square
Wageningen
Wageningen WUR, Stippeneng 2 , Wageningen, netherlands, 6708 WE
Wageningen is located on the banks of the Lower Rhine. Excavations date to the first settlements in this area around the Stone Age. The hills to the east of the city offered protection from floods of the Rhine from the Bronze Age. The city has a turbulent history and has been occupied or destroyed several times. The Rhine also changed course in 1421, moved further south and therefore had an adverse effect on the Wageningen trade. In the 17th century, the city started growing tobacco and there were several cigar manufacturers. The floodplains of the Rhine to the south also had several brickworks, one of which can still be seen.
In 1876, the Dutch government decided to build the first agricultural school in Wageningen because it was in the heart of the country and surrounded by a wide variety of soils. Since then, the city has grown enormously and Wageningen University is now a world-famous Life Sciences university. Wageningen also has an important inland port.
The halls of Impulse
Centrally located on Wageningen Campus, near the De halen van Impulse. The glass building and the cheerful colors provide a welcoming atmosphere. Impulse is an excellent location for not too large symposia or training courses. Impulse is located in building 115 on the Campus.
Address Stippeneng 2
6708 WE Wageningen
Wageningen Campus is indicated at the main roads of Wageningen. Follow the P-route to P3 on the campus. The route is indicated from all large parking spaces to the individual buildings on the campus. Impulse's building number is 115.
Arnhem
Arnhem Park Tower, Nieuwe stationsstraat 20, Arnhem, Netherlands, 6811 KS
The Arnhem Nijmegen region is known as a conference destination and has a thriving food and health sector, thanks in part to the presence of two universities.
The Park Tower is located in a modern building on top of the train station in the center of Arnhem's business district. The railway connects the city to national and international cities. Moreover, Arnhem is close to the German border and is easily accessible due to the many train routes. From the 13th and 14th floors of the city center you have a view over the city and the World Trade Center is right next door.
This instructor-led, live training in Nijmegen (online or onsite) is aimed at beginner-level to intermediate-level data analysts who wish to gain practical knowledge of Tableau Prep Builder and the essential mapping functionalities in Tableau to address data preparation and visualization challenges.
By the end of this training, participants will be able to:
Connect to a variety of data sources, including cloud-based and local files, and manage live and extracted data connections.
Perform data fusion and combination using advanced joining techniques to merge multiple datasets from different sources for better analysis.
Create calculated fields and perform operations to manipulate and analyze data dynamically.
Publish and update prepared data to Tableau Server or Tableau Online, enabling automated updates and scheduling.
Create basic and advanced maps with geographic data, including filled maps, density maps, and dual-axis maps.
Apply mapping techniques to solve real-world business problems by creating interactive, detailed geographic visualizations.
This instructor-led, live training in Nijmegen (online or onsite) is aimed at beginner-level to intermediate-level data analysts who wish to use Tableau Desktop to transform raw data into meaningful insights through graphical representations such as charts, graphs, maps, and tables.
By the end of this training, participants will be able to:
Connect to multiple types of data sources (Excel, CSV, databases, cloud-based) and understand the distinctions between live and extract connections.
Prepare and clean data for analysis, including renaming fields, handling null values, and combining datasets through joins and blends.
Create basic visualizations such as tables, bar charts, line charts, and maps, and apply filters to refine data presentations.
Develop intermediate visualizations including geographic maps, dual-axis charts, and use hierarchies, groups, and sets to enhance analysis.
Build calculated fields and parameters to create dynamic and customized visualizations based on user inputs and logic functions.
Design interactive dashboards and stories, incorporating multiple visualizations and filters to tell a cohesive narrative.
This instructor-led, live training in Nijmegen (online or onsite) is aimed at intermediate-level digital forensic and cybersecurity professionals who wish to have a comprehensive understanding and practical skills in using Tableau Forensic Imager for digital forensic purposes.
By the end of this training, participants will be able to:
Understand the role and importance of digital forensic imaging in investigations.
Operate Tableau Forensic Imager to acquire forensically sound images.
Apply best practices in handling and preserving digital evidence.
Navigate the software interface to configure, execute, and manage imaging tasks.
Analyze and validate forensic images to ensure integrity and admissibility in court.
This instructor-led, live training in Nijmegen (online or onsite) is aimed at intermediate to advanced-level data architects who wish to learn skills for installing, configuring, managing, and maintaining a Tableau server.
By the end of this training, participants will be able to:
Have an in-depth understanding of the Tableau Server architecture.
Understand Tableau Server processes and functions.
User Tableau Server to automate tasks.
Configure and manage the Tableau Server.
Set up Tableau Server for high availability and scalability.
This instructor-led, live training in Nijmegen (online or onsite) is aimed at data scientists and developers who wish to use and integrate SQL, Python, and Tableau to perform complex data analysis, processing, and visualization.
By the end of this training, participants will be able to:
Set up the necessary environment to perform data analysis with SQL, Python, and Tableau.
Understand the key concepts of software integration (data, servers, clients, APIs, endpoints, etc.).
Get a refresher on the fundamentals of Python and SQL.
Perform data pre-processing techniques in Python.
Learn how to connect Python and SQL for data analysis.
Create insightful data visualizations and charts with Tableau.
This course teaches you about human perception and how to leverage it to deliver the best insights. You will get familiar with design theory, including Gestalt Laws, pre-attentive attributes, and inclusivity. You will also understand the similarities and differences between exploratory and explanatory analysis. You will discover the usage of the charts and learn how to choose the most suitable one. At the end of the course, you will know how to implement the design principles is visualizations created using Tableau software.
This is a Tableau user beginners course; it is intended for anyone who is looking to work with data and is designed to help you use the main functions in Tableau.
During the course you will be able to:
Connect to your data.
Edit and save a data source.
Understand Tableau terminology.
Use the Tableau interface / paradigm to effectively create powerful visualizations.
Create basic calculations including basic arithmetic calculations, custom aggregations and ratios, date math, and quick table calculations.
Represent your data using the following visualization types:
Cross tabs
Geographic maps
Heat maps
Tree maps
Pie charts and bar charts
Dual axis and combined charts with different mark types
This instructor-led, live training in Nijmegen (online or onsite) is aimed at data scientists who wish to program in R for Tableau.
By the end of this training, participants will be able to:
Implement Tableau analytics with R.
Return values to Tableau with learning algorithms in R.
Structure and visualize R functions in Tableau.
Make data driven decisions for business operations.
In this instructor-led, live training in Nijmegen, participants will learn how to extend the capabilities of Tableau to fit the specific needs of their organization.
By the end of this training, participants will be able to:
Install and configure Tableau (Desktop, Server, Online.)
Understand the fundamentals of developing with Tableau.
Create and publish data visualizations and interactions with Tableau.
Use Tableau's developer tools and APIs to customize and extend the capabilities of Tableau for their organization.
This instructor-led, live training in Nijmegen (online or onsite) is aimed at data analysts and data scientists who wish to search, analyze, and visualize data using Tableau.
By the end of this training, participants will be able to:
Connect to your data.
Edit and save a data source.
Understand Tableau terminology.
Use the Tableau interface / paradigm to effectively create powerful visualizations.
Create calculations including arithmetic calculations, custom aggregations and ratios, date math, and table calculations.
Represent your data using different visualization types.
This instructor-led, live training in Nijmegen (online or onsite) is aimed at data analysts who wish to prepare and shape data using Tableau Prep Builder.
By the end of this training, participants will be able to:
Install Tableau Prep.
Understand and implement a Data Science Workflow.
Read data from a variety of sources, such as Excel and databases.
Prepare, shape and sample data for analysis in Tableau Desktop.
Tableau is a business intelligence and data visualization tool. Python is a widely used programming language which provides support for a wide variety of statistical and machine learning techniques. Tableau's data visualization power and Python's machine learning capabilities, when combined, help developers rapidly build advanced data analytics applications for various business use cases.
In this instructor-led, live training, participants will learn how to combine Tableau and Python to carry out advanced analytics. Integration of Tableau and Python will be done via the TabPy API.
By the end of this training, participants will be able to:
Integrate Tableau and Python using TabPy API
Use the integration of Tableau and Python to analyze complex business scenarios with few lines of Python code
Audience
Developers
Data scientists
Format of the course
Part lecture, part discussion, exercises and heavy hands-on practice
This instructor-led, live training in Nijmegen (online or onsite) is aimed at beginner to intermediate-level data scientists and analysts who wish to learn how to utilize Tableau tools for data visualization and analysis.
By the end of this training, participants will be able to:
Connect multiple sources of data.
Create basic data visualizations.
Use basic to advanced calculations for data analysis.
Learn best practices for using graphs and visualizations.
This course is designed for the learner who has never used Tableau before, or who may need a refresher. It will guide you through the steps necessary to create your first visualization from the beginning. You will also learn how to apply essential design principles to your Tableau visualizations. By the end of the course, you will be able to create and share your insights with the broader audience.
This is a compelling 4-day course for Tableau beginners. During this course, you will get familiar with all Tableau features and learn how to create and share data visualization with others. The course will guide you through all of the steps, including connecting to data, creating calculations, choosing a chart, building the dashboard, and publishing your work.
The course is divided into lectures dedicated to each topic, followed by practical exercises. The course will end with 30 minutes test and 60 minutes project assignment.
Course milestones:
Get familiar with Tableau interface.
Connect to and work with your data.
Use the Tableau features.
Build an insightful visualization.
Share your work with a broader audience.
Format of the Course:
Interactive lecture and discussion.
Lots of exercises and practice.
Hands-on implementation in a live-lab environment.
Knowledge test and hands-on project at the end of the course
Read more...
Last Updated:
Testimonials (6)
The energy, knowledge and style of teaching of the trainer
Ioana - MOLSONCOORS GLOBAL BUSINESS SERVICES SRL
Course - From Tableau Beginners to Advanced User
Weronika created a really friendly, informal atmosphere. The training involved a lot of useful knowledge transfer, technical skills exercises and theory, as well as best practices and guidance on how to handle our own data.
Julia Kuczma - DLA Piper GSC Poland Sp. z o.o.
Course - Tableau Intermediate Training Course
The trainer answered all of my questions and gives us a walkthrough.
Mark Xavier Rimas - AIGSS- BPI
Course - Tableau Fundamentals to Advanced
The knowledge of trainor about the tool.
Kendrick Bacani - Thakral One Inc.
Course - Data analysis with Tableau
In terms of product knowledge, he’s really knowledgeable and very open to answer questions.
Cherry Espinili - Infinit-O Manila
Course - Tableau Fundamentals
I genuinely enjoyed the trainer's helping.
Urszula Kuza
Course - Tableau Advanced
Provisional Upcoming Courses (Contact Us For More Information)
Online Tableau training in Nijmegen, Tableau training courses in Nijmegen, Weekend Tableau courses in Nijmegen, Evening Tableau training in Nijmegen, Tableau instructor-led in Nijmegen, Tableau on-site in Nijmegen, Online Tableau training in Nijmegen, Evening Tableau courses in Nijmegen, Tableau private courses in Nijmegen, Tableau one on one training in Nijmegen, Tableau classes in Nijmegen, Tableau coaching in Nijmegen, Tableau instructor-led in Nijmegen, Tableau trainer in Nijmegen, Weekend Tableau training in Nijmegen, Tableau boot camp in Nijmegen, Tableau instructor in Nijmegen